

GOLD
| R3 | R2 | R1 | PP | S1 | S2 | S3 |
| 1837.81 | 1829.27 | 1822.68 | 1814.14 | 1807.55 | 1799.01 | 1792.42 |
| R1 | R2 | R3 |
| 1822.68 | 1829.27 | 1837.81 |
| PP | ||
| 1814.14 | ||
| S1 | S2 | S3 |
| 1807.55 | 1799.01 | 1792.42 |
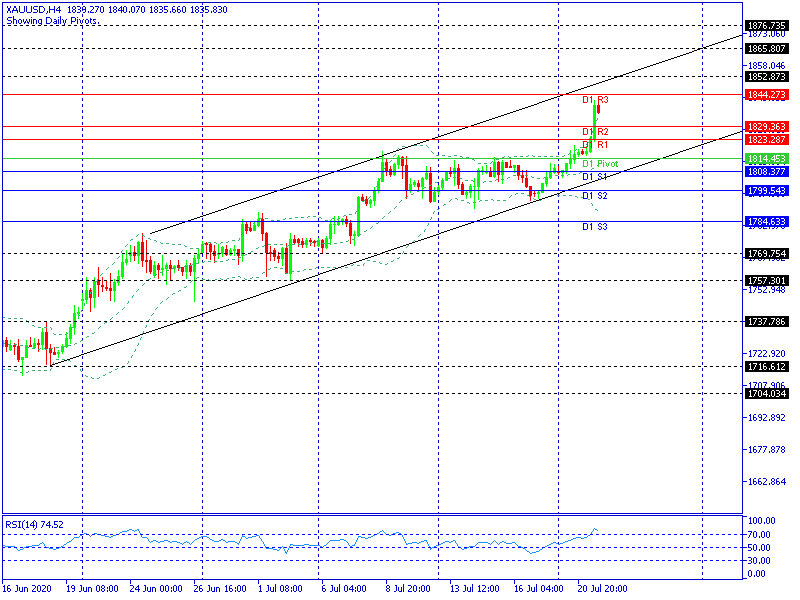
Gold nampak mengusik resisten 1844.273
Ekstensi kontrol buyers di atas 1844.273, mempertajam bullish Gold. Target berikut 1852.873. Resisten lanjutan 1865.807 dan 1876.735
Bila gagal dan tertekan di bawah 1823.287, rentan test support kuat, 1814.453-1808.377
| Technical | 15 Minutes | Hourly | Daily |
| Indicators | Strong Buy | Buy | Strong Buy |
| Moving Averages | Strong Sell | Buy | Strong Buy |
| Summary | Strong Buy | Strong Buy | Strong Buy |
USOIL
| R3 | R2 | R1 | PP | S1 | S2 | S3 |
| 42.28 | 41.65 | 41.24 | 40.61 | 40.20 | 39.57 | 39.16 |
| R1 | R2 | R3 |
| 41.24 | 41.65 | 42.28 |
| PP | ||
| 40.61 | ||
| S1 | S2 | S3 |
| 40.20 | 39.57 | 39.16 |
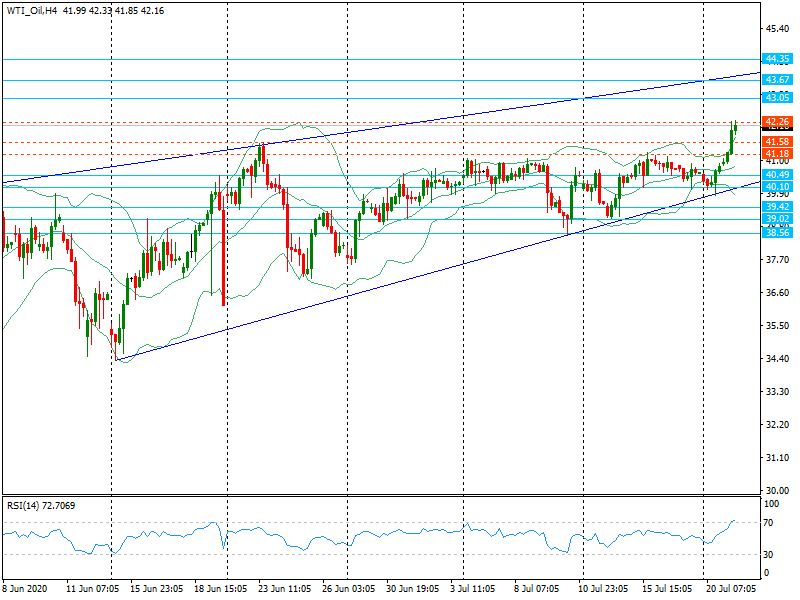
Jejak naik Oil terdeteksi membidik resisten kritis 42.26
Penetrasi di atas 42.26 disertai intensitas beli , mempertajam bullish Oil. Test berikut 43.05 dan 43.67.Target optimal 44.35
Fase koreksi turun akan menjumpai perlawanan ketat pertama pada level 41.58 dan 41.18.Support kuat, 40.49
| Technical | 15 Minutes | Hourly | Daily |
| Indicators | Strong Buy | Strong Buy | Strong Buy |
| Moving Averages | Strong Sell | Strong Sell | Strong Sell |
| Summary | Strong Buy | Strong Buy | Strong Buy |
EURUSD
| R3 | R2 | R1 | PP | S1 | S2 | S3 |
| 1.1543 | 1.1505 | 1.1476 | 1.1438 | 1.1409 | 1.1371 | 1.1342 |
| R1 | R2 | R3 |
| 1.1476 | 1.1505 | 1.1543 |
| PP | ||
| 1.1438 | ||
| S1 | S2 | S3 |
| 1.1409 | 1.1371 | 1.1342 |
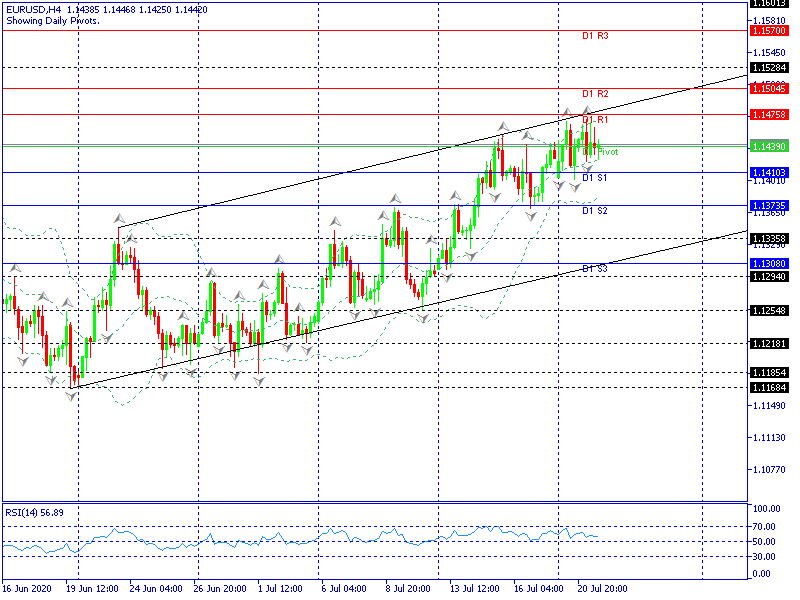
EURUSD nampak berupaya konsisten melaju di atas 1.14390, dengan target awal re-test resisten 1.14758
Pergerakan di atas 1.14758, mempertegas bullish EURUSD. Test selanjutnya 1.15045 dan 1.15284. Resisten kuat, 1.15700
Fase koreksi turun akan menjumpai perlawanan ketat pada level 1.14103 dan 1.13735. Support kuat pada area 1.13080-1.12940.
| Technical | 15 Minutes | Hourly | Daily |
| Indicators | Strong Buy | Strong Buy | Strong Buy |
| Moving Averages | Strong Buy | Strong Buy | Strong Buy |
| Summary | Strong Buy | Strong Buy | Strong Buy |
USDJPY
| R3 | R2 | R1 | PP | S1 | S2 | S3 |
| 108.04 | 107.78 | 107.52 | 107.26 | 107.00 | 106.74 | 106.48 |
| R1 | R2 | R3 |
| 107.52 | 107.78 | 108.04 |
| PP | ||
| 107.26 | ||
| S1 | S2 | S3 |
| 107.00 | 106.74 | 106.48 |
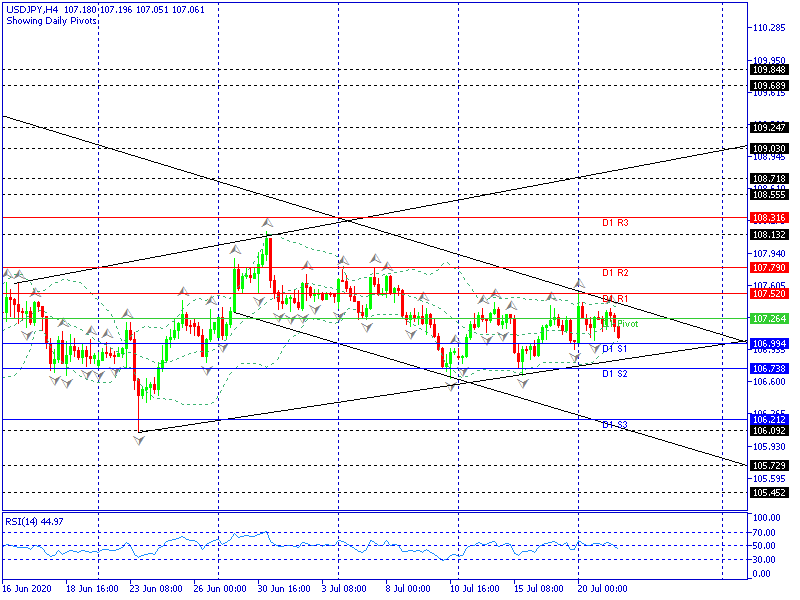
USDJPY terdeteksi membidik support 106.994 dan support kritis 106.738
Penetrasi di bawah 106.738 ditopang ekstensi kontrol sellers, mempertajam bearish USDJPY. Target berikut 106.212-106.092.
Jika gagal dan rebound di atas 107.520, membuka kans re-test 107.790 hingga 108.316
| Technical | 15 Minutes | Hourly | Daily |
| Indicators | Strong Sell | Strong Sell | Strong Sell |
| Moving Averages | Strong Sell | Strong Sell | Strong Sell |
| Summary | Strong Sell | Strong Sell | Strong Sell |
GBPUSD
| R3 | R2 | R1 | PP | S1 | S2 | S3 |
| 1.2862 | 1.2764 | 1.2713 | 1.2615 | 1.2564 | 1.2466 | 1.2415 |
| R1 | R2 | R3 |
| 1.2713 | 1.2764 | 1.2862 |
| PP | ||
| 1.2615 | ||
| S1 | S2 | S3 |
| 1.2564 | 1.2466 | 1.2415 |
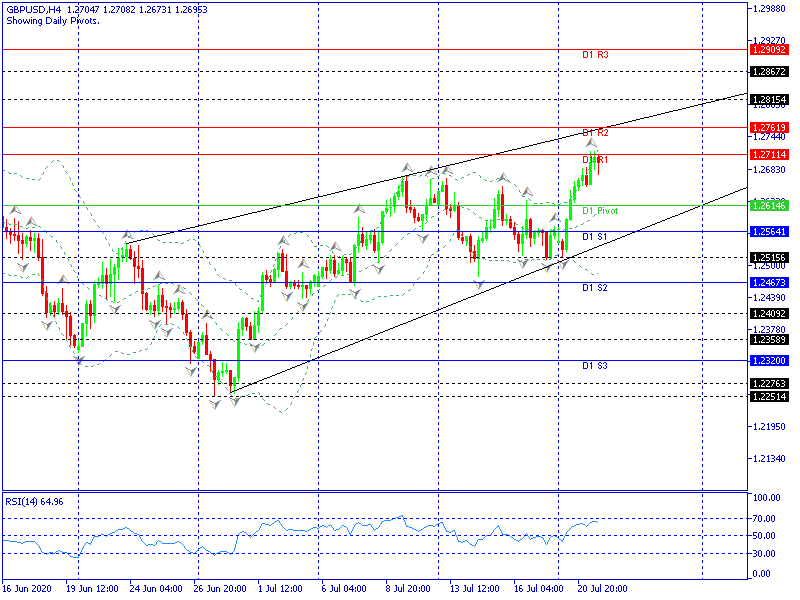
Geliat naik GBPUSD berpotensi mendobrak resisten 1.27114 dan resisten kritis 1.27619
Ekstensi kontrol buyers di atas 1.27619, mempertegas bullish GBPUSD. Test berikut 1.28154 dan 1.28672. Resisten kuat, 1.29092
Fase koreksi turun akan menjumpai perlawanan ketat sejak level 1.26146 hingga support kuat, 1.25641
| Technical | 15 Minutes | Hourly | Daily |
| Indicators | Strong Buy | Strong Buy | Strong Buy |
| Moving Averages | Strong Buy | Strong Buy | Strong Buy |
| Summary | Strong Buy | Strong Buy | Strong Buy |
AUDUSD

| R3 | R2 | R1 | PP | S1 | S2 | S3 |
| 0.7077 | 0.7047 | 0.7031 | 0.7001 | 0.6985 | 0.6955 | 0.6939 |
| R1 | R2 | R3 |
| 0.7031 | 0.7047 | 0.7077 |
| PP | ||
| 0.7001 | ||
| S1 | S2 | S3 |
| 0.6985 | 0.6955 | 0.6939 |
AUDUSD terdeteksi telah menembus resisten di level 0.7045
AUDUSD di prediksi akan terus naik ke level 0.7217 pada fibo 161.8
Koreksi turun yang dapat terjadi jika AUDUSD kembali turun menembus level 0.7045 (yang tadinya Resisten tapi kini menjadi supportnya) adalah level 0.6794
| Technical | 15 Minutes | Hourly | Daily |
| Indicators | Strong Buy | Strong Buy | Strong Buy |
| Moving Averages | Strong Buy | Strong Buy | Strong Buy |
| Summary | Strong Buy | Strong Buy | Strong Buy |
USDCAD

| R3 | R2 | R1 | PP | S1 | S2 | S3 |
| 1.3661 | 1.3631 | 1.3583 | 1.3553 | 1.3505 | 1.3475 | 1.3427 |
| R1 | R2 | R3 |
| 1.3583 | 1.3631 | 1.3661 |
| PP | ||
| 1.3553 | ||
| S1 | S2 | S3 |
| 1.3505 | 1.3475 | 1.3427 |
USDCAD di prediksi dapat melemah menuju support di level 1.3314
Jika USDCAD gagal menembus level 1.3300 maka USDCAD di prediksi akan kembali naik ke resisten di level 1.3487
Jika USDCAD menembus level 1.3300 maka USDCAD di prediksi akan terus turun ke support di level 1.3018
| Technical | 15 Minutes | Hourly | Daily |
| Indicators | Strong Sell | Strong Sell | Strong Sell |
| Moving Averages | Strong Sell | Strong Sell | Strong Sell |
| Summary | Strong Sell | Strong Sell | Strong Sell |
EURJPY

| R3 | R2 | R1 | PP | S1 | S2 | S3 |
| 124.01 | 123.51 | 123.13 | 122.63 | 122.25 | 121.75 | 121.37 |
| R1 | R2 | R3 |
| 123.13 | 123.51 | 124.01 |
| PP | ||
| 122.63 | ||
| S1 | S2 | S3 |
| 122.25 | 121.75 | 121.37 |
EURJPY telah turun ke level 122.45
Jika EURJPY gagal tembus level 122.40 maka EURJPY kembali naik ke level 123.03
Jika EURJPY tembus level 122.25-122.40 maka EURJPY terus turun ke level 121.93
| Technical | 15 Minutes | Hourly | Daily |
| Indicators | Strong Sell | Strong Sell | Strong Buy |
| Moving Averages | Sell | Sell | Strong Buy |
| Summary | Strong Sell | Strong Sell | Strong Buy |
GBPJPY

| R3 | R2 | R1 | PP | S1 | S2 | S3 |
| 137.97 | 136.95 | 136.38 | 135.36 | 134.79 | 133.77 | 133.20 |
| R1 | R2 | R3 |
| 136.38 | 136.95 | 137.97 |
| PP | ||
| 135.36 | ||
| S1 | S2 | S3 |
| 134.79 | 133.77 | 133.20 |
GBPJPY saat ini sedang terkoreksi turun ke level 135.78
GBPJPY di prediksi masih dapat naik ke level 136.51 hingga fibo 181.8 di fibo 137.12
Koreksi turun bisa berlanjut sebatas level 135.42 hingga level 135.15 pada fibo 61.8
| Technical | 15 Minutes | Hourly | Daily |
| Indicators | Strong Sell | Buy | Strong Buy |
| Moving Averages | Buy | Buy | Strong Buy |
| Summary | Neutral | Buy | Strong Buy |
USDCHF

| R3 | R2 | R1 | PP | S1 | S2 | S3 |
| 0.9449 | 0.9430 | 0.9410 | 0.9391 | 0.9371 | 0.9352 | 0.9332 |
| R1 | R2 | R3 |
| 0.9410 | 0.9430 | 0.9449 |
| PP | ||
| 0.9391 | ||
| S1 | S2 | S3 |
| 0.9371 | 0.9352 | 0.9332 |
USDCAHF saat ini bergerak antara pivot dan S1 di level 0.9370-0.9390
Jika USDCHF tembus level 0.9390 maka USDCHF akan terus naik ke R1 di level 0.9407 hingga R2 di level 0.9426
Jika USDCHF tembus level 0.9365 maka USDCHF akan turun ke S2 di level 0.9353
| Technical | 15 Minutes | Hourly | Daily |
| Indicators | Strong Buy | Sell | Strong Sell |
| Moving Averages | Sell | Sell | Strong Sell |
| Summary | Neutral | Sell | Strong Sell |


